
A year or so ago our property valuations went up.
As I looked into the school district funding I expected to see that the school brought in more money.
It did.
Since our assessed property values went up a lot I expected to see the money going to the school go up a lot.
It didn’t.
Now how does that make any sense?
Oh it doesn’t but it gets way worse.
Let me demonstrate how complicated and confusing this gets.
Which of these statements are false for Wooster?
A – We are paying more in property tax on average.
B – Our property values jumped up about 35%
C – The school district is making only about 4% more money in property taxes since the increase.
D – Our effective property tax rate going to the school district has dropped by about 10 mils since the property increase.
Ready?
Trick question.
They are all true.
That is the kind of weird mathematical madness that I found waiting for me.
It is no wonder the average person doesn’t understand how the district funding system works, you have to dive deeply into math to see how it could even possibly make sense.
But I am not here to dive into math magic.
I will try to shrink what I found down to numbers and shapes we can all understand.
The numbers I will use here are rounded and simplified but accurate to the best of my ability.
Here is what I found: The Wooster school district got a bad raise.
Why did it even get a raise?
The raise happened because the schools are mostly funded by local property taxes.
This is not a raise the district earned, it is just a result of our property being assessed up.
The district also didn’t request this raise, the reassessment was imposed by State mechanisms.
So, when our assessed property values go up the money going to the district should go up.
We expect the school district to get a raise when our property value goes up.
Why is it a bad raise?
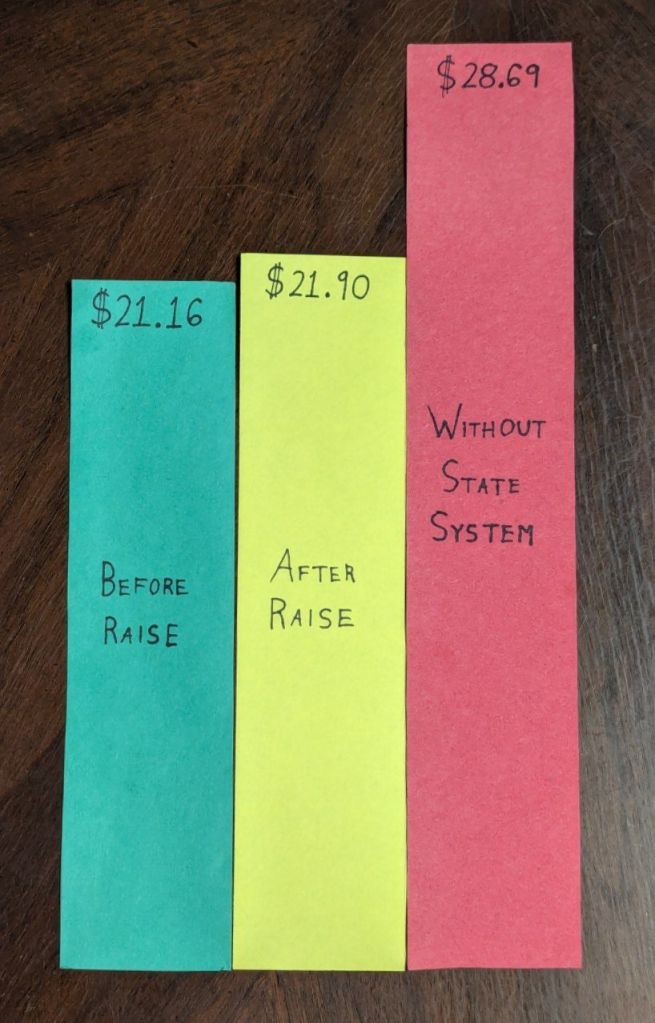
Well, let me give an example with workable numbers.
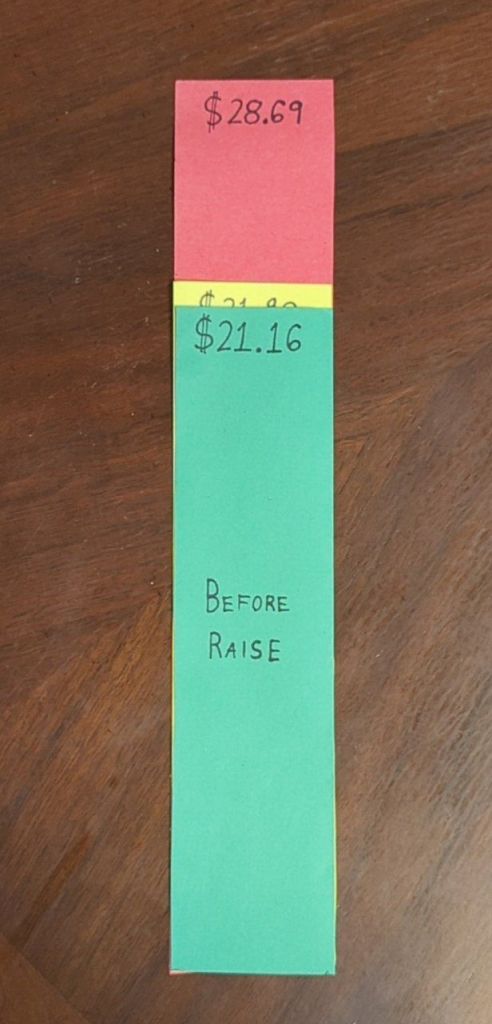
Before the property increase the district was making $21.16 each cycle.
With how much the average Wooster property increased, the district should have made $28.69 the next cycle.
It made $21.90 instead.
That is technically a raise.
I don’t know about you but if I was supposed to get a raise of $7.53 and instead got 74¢ I would call it a bad raise.
How is that even possible?
The short answer is, “Because the State says so.”
The long answer is that the State has systems in place to partially protect communities from the school districts when property values go up.
The system seems to be designed so that school districts are forced to occasionally go back and check with their community voters instead of just being handed money for no reason.
But the system is also designed so that the schools will not be starved for funds and will have a minimum level of funding so they don’t have to bother their voters every single time property values increase a little.
In my previous post I used an analogy where the school district has 12 machines that harvest our property taxes to gather the school’s share.
The State system works through those machines.
One specific machine collects what the State calls “inside mils.”
The State says we can’t touch that one and someone else sets how much it collects.
When property values go up, it collects more.
When property values go down, it collects less, at least in theory.
The rest of the machines collect what the State calls “outside mils.”
We have to vote these into existence.
These harvesting machines from the analogy are the levies and bonds we have voted on in the past.
A new levy asks to make a new machine.
A renewal levy asks to keep a machine that is about to time out running longer.
The trick is, if our property values go up these machines can have their power turned down.
With their power turned down they collect around the same amount in total taxes but lower our effective tax rate.
This is how our effective tax rate has dropped 10 mils even though our tax payments have gone up.
Our values went up and the State system kicked in and turned the power down on all of the “outside mil” machines.
The 10 mils is how much those machines had to be turned down in total.
So, how did the schools make more money?
The single “inside mils” machine can’t have its power turned down, so it has chugged along at the same rate.
This single machine collects about 1/10th of our taxes so the schools got a 1/10th of the increase.
By the numbers, our property values in Wooster went up about 35% on average.
So if the district was making $1 before it should have been making $1.35 afterwards.
Since the State system turned down the “outside mils” machines, the district made about $1.04 afterwards instead.
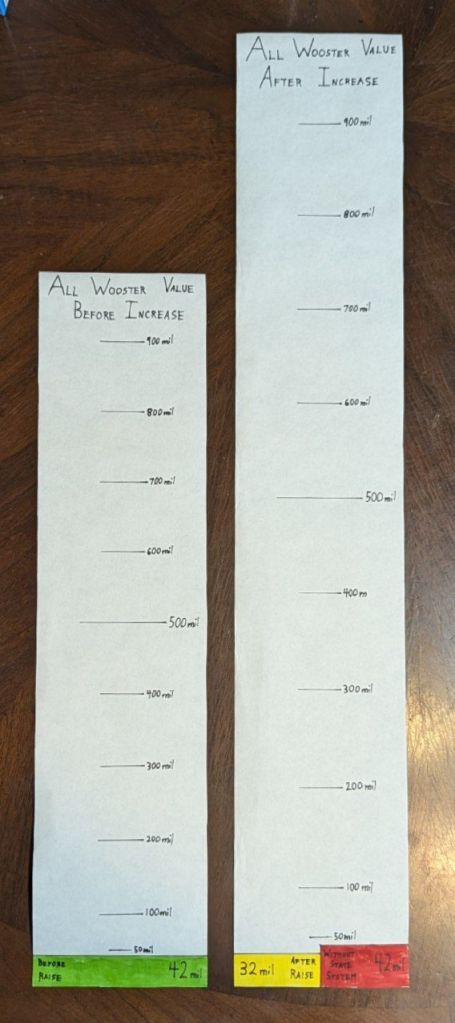
On the left is the total value of all residential and agricultural properties in Wooster.
The bar is divided into a measure of mils with the full bar being 1000 mils [the entire value]
At the bottom of the left bar is a green colored area that is the district’s share before the property increase.
The green section is set at 42 mils, our previous school property tax effective rate.
The bar on the right is the total increase of Wooster’s property value.
The difference between the bars is a 35% increase.
It is divided into the same measure of 1000 mils.
The red section at the bottom represents the same 42 mils as the green section from the left hand bar.
It is now bigger because when the total value of Wooster increases then the regular markings of the mils is stretched, so the same 42 mils gathers more money.
The yellow section at the bottom represents the district share after it has been adjusted down by the State system.
This yellow section is now set at 32 mils.
The difference between the red and yellow sections of this right hand bar is the 10 mil drop in our school property tax effective rate.

This shows the same thing as the green, yellow, and red bars from the raise example.
This shows the district’s 4% money flow increase.
This indicates that we are paying more in taxes, yellow being bigger than green, even though our effective tax rate has gone down 10 mils.
So now I have answers for why all the above statements A, B, C and D were all true.
A – We are paying more in property tax.
This is because our property values went up.
B – Our property values went up about 35%.
This happened because the State mandated a reassessment of our properties.
C – The school district is making only about 4% more money in property taxes since the increase.
This is because Wooster triggered the State system that turned down the tax rate on most of the school’s share.
D – Our effective property tax rate going to the school district has dropped by about 10 mils since the property increase.
This is how much the “outside mil” machines were turned down by the State system.
So the school’s share in total only went up a little.
But our taxes went up a lot.
So where is the rest going?
The school district is where most of our property tax bill goes but not all of it.
Those other destinations for our taxes don’t seem to have the same State system so they went up a lot.
Mix that larger increase with the school’s smaller increase and you get something in the middle.
What if the State system didn’t trigger for Wooster?
The increase we have had would have been even worse.
There is a formula for how much the machines are turned down and Wooster seems to have seen the most benefit from it by far.
Our neighboring school districts saw their taxes increase by a proportionally much higher amount.
The small amount of protection from the State system is nice but now our community is having to sort through the effects of a complex system that does not make intuitive sense.
I think, now that I have studied it, that the State system is there to protect us, the local communities, from big jumps giving the district a bunch of money we never voted on.
It is interesting that the State also tries to protect the district from collapsing if inflation drives property values up.
I suspect this is because this system was put in place during the financial turmoil of the mid 1970s.
That was before my time but I get the impression there was a lot of inflation and even more confusing stagflation.
Looking back through the history and looking closer at the different inside and outside mils harvesting machines led me to even more surprises.
That will be the topic of my next post.
Now that we have the general shape of things it will be time to get into the details.
There will be more numbers, you have been warned.
If you have any questions I am happy to try to answer.
This system is very confusing but I hope the smaller numbers and visuals have helped make things a little clearer.


Leave a comment